
BRBR — What does recovery actually have to look like?
BRBR at $7.94 looked like one of those situations where the chart is screaming “broken” a lot louder than the business is.
Revenue was holding up. Profitability absolutely was not. That is the whole problem. The question is not whether Premier Protein still exists; it is whether enough of the margin damage is temporary for stable demand, partial recovery and deleveraging to make the equity work from here.
This is the dated work behind a planned ~$5,000 starter. No position existed when I ran it.
Reference share price: $7.94 on September 24, 2026.
The page stays frozen to the evidence I had through September 24. The current BRBR record can move later; this one does not.
For valuation I use the Bear / Base / Bull Playbook. BRBR takes the no → yes → yes path: current earnings are a bad anchor, leverage matters, and share count can move. The useful chain is revenue → EBITDA margin → EV/EBITDA → net debt → diluted shares.
I also run the Capital Allocation Playbook because a leveraged recovery can work operationally and still leave equity holders wondering where the money went.
These are my scenarios. They are not BellRing guidance, and they definitely are not me promising where the stock goes.
Okay, what am I actually betting on?
Before touching a multiple, I want the bet in one sentence:
Is the current profitability collapse temporary enough that stable demand + partial margin recovery + deleveraging create attractive equity returns from a distressed price?
That immediately tells me this should not start with a normal current P/E.
The company is literally in the middle of the normalization problem. Using today’s depressed earnings as if they are normal would give me very tidy math for the wrong question.
The numbers are ugly in a very specific way
The model comes after the facts. Company-reported numbers first; my assumptions second.
BellRing’s Q3 FY2026 release showed:
| Reported input | Q3 / current evidence |
|---|---|
| Net sales | $570.4M, +4.2% |
| Gross margin | 28.6%, down from 35.4% |
| Adjusted EBITDA | $78.3M, down from $120.3M |
| FY2026 sales guide | $2.335B–$2.375B |
| FY2026 adjusted EBITDA guide | $275M–$295M |
| Implied guided EBITDA margin | ~12% |
| Inventory | $480.6M |
| Long-term debt | $1.135B |
| Nine-month repurchases | $133.1M at $27.41/share |
Primary source: BellRing Q3 FY2026 earnings release.
For context, FY2025 was a completely different profitability picture: roughly $2.3B of sales and $482M of adjusted EBITDA. That gap between fairly resilient sales and collapsing profitability is basically the entire thesis. BellRing 2025 Annual Report.
The Q3 supplemental also showed Premier Protein RTD consumption up 6%, distribution points up 27%, household penetration at 21.9%, and continued category leadership. BellRing Q3 FY2026 supplemental — SEC.
That is the tension I care about: the consumer data does not look like a brand falling off a cliff. The income statement absolutely looks like something went very wrong.
The few things that actually drive this
For BRBR, the big levers are:
- revenue
- EBITDA margin
- net debt
- share count
- exit EV/EBITDA
Why EV/EBITDA instead of just P/E?
Because leverage matters here. A recovery that produces $500M of EBITDA is worth very different amounts to the equity depending on whether BellRing still owes roughly $1B or has paid a meaningful chunk of it down.
So the bridge is:
enterprise value from operating earnings → subtract net debt → divide by shares
No equation wallpaper required.
The next few months are basically a stabilization test
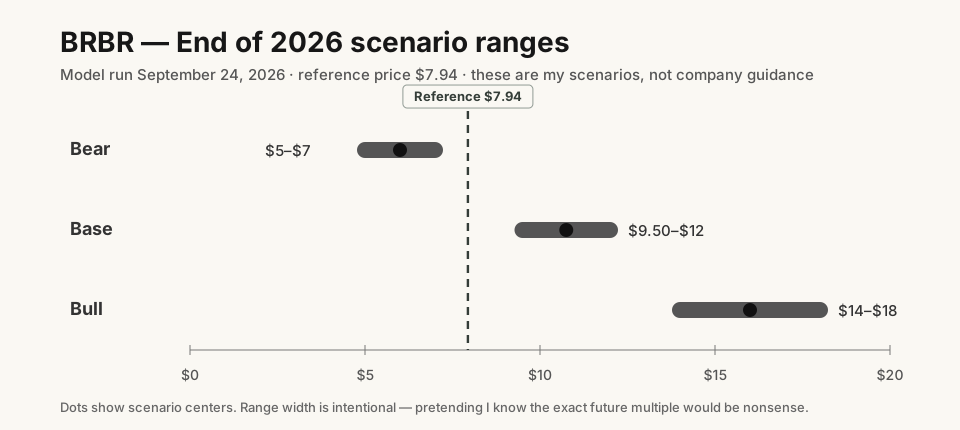
For the rest of 2026, this was the range I was underwriting:
| Scenario | Price range | Center | What has to happen |
|---|---|---|---|
| Bear | $5–$7 | ~$6 | Margin/input-cost pressure stays ugly, promotions remain heavy, and the FY2027 setup disappoints |
| Base | $9.50–$12 | ~$10.75 | The business stops getting worse, FY2027 guidance shows stabilization, and the market gives some credit for partial margin recovery |
| Bull | $14–$18 | ~$16 | Q4/FY2027 outlook comes in cleaner than feared, margin recovery looks more credible, and the stock rerates from distressed levels |
From the $7.94 reference price:
- Bear: -37% to -12%
- Base: +20% to +51%
- Bull: +76% to +127%
Notice what is missing: “it used to trade at $70, therefore bull case $70.”
Old stock prices are not valuation inputs.
By 2027 I should have a much better answer
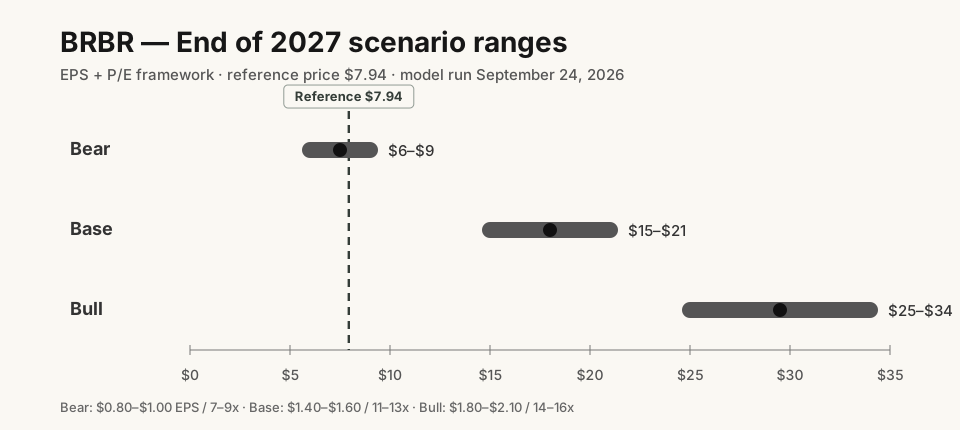
End-2027 is the more useful checkpoint.
This is a checkpoint, not the primary valuation engine. The full model still uses revenue → EBITDA → enterprise value → net debt → shares because leverage is too important to hide inside a P/E. I use the 2027 EPS table only to ask what a partially normalized business could look like by then.
By then I should have enough evidence to know whether margins are actually recovering or whether I was just getting more elaborate about explaining away a broken thesis.
| Scenario | EPS assumption | P/E range | Implied price |
|---|---|---|---|
| Bear | $0.80–$1.00 | 7–9x | $6–$9 |
| Base | $1.40–$1.60 | 11–13x | $15–$21 |
| Bull | $1.80–$2.10 | 14–16x | $25–$34 |
My base-case center is deliberately boring:
| Base-case input | Value |
|---|---|
| EPS | ~$1.50 |
| P/E | 12x |
| Implied price | ~$18 |
So the base case is basically $1.50 of EPS at 12x, or roughly $18/share.
From $7.94, the full ranges imply roughly:
- Bear: -24% to +13%
- Base: +89% to +164%
- Bull: +215% to +328%
I care a lot less about whether $18 “feels right” than whether $1.50 of EPS and a 12x multiple are defensible. At least that gives me something concrete to argue with later.
Why $5,000 is enough
At $7.94, $5,000 would represent about 630 shares before execution-price differences.
If those shares were still held at the end of 2027:
| Scenario | BRBR price range | Approx. value of $5K |
|---|---|---|
| Bear | $6–$9 | $3.8K–$5.7K |
| Base | $15–$21 | $9.4K–$13.2K |
| Bull | $25–$34 | $15.7K–$21.4K |
This is where the model stops being a fun spreadsheet and starts affecting the size of the actual bet.
A $5K starter already matters if the thesis works. If it fails, the mistake stays the size of a mistake instead of becoming a portfolio event. I do not get anything extra for making the position twice as large just to prove I believe the thesis.
Percentages without position size are only half an investment decision.
I do not want the thesis resting on one rerating
The five-year recovery model exists so the whole thesis does not depend on the market deciding to pay a higher P/E in 2027.
| Scenario | 2031 revenue | EBITDA margin | EBITDA | Exit EV/EBITDA | Net debt | Shares | Implied price |
|---|---|---|---|---|---|---|---|
| Bear | $2.40B | 12% | $288M | 6x | $1.0B | 116M | ~$6.30 |
| Base | $2.90B | 16% | $464M | 8x | $0.6B | 110M | ~$28.30 |
| Bull | $3.30B | 19% | $627M | 10x | $0.3B | 105M | ~$56.90 |
From $7.94, rerunning the arithmetic gives roughly -4.6% / +28.9% / +48.3% annualized for bear/base/bull.
The $28.30 endpoint is less useful than the bridge required to get there: revenue, margins, leverage and shares all have to cooperate before that number is even possible.
Is this really an expectations gap, or compensation for a broken balance sheet?
October 8, 2026 perspective, holding the September 24 price and original assumptions fixed. Reverse the five-year recovery bridge above. Keep $2.90B 2031 revenue, $600M net debt, 110M diluted shares and 8x EV/EBITDA. Then:
Required EBITDA = [(future share price × 110M shares) + $600M net debt] / 8.
| Five-year return requirement | Necessary 2031 share price | EBITDA required | EBITDA margin on $2.90B sales |
|---|---|---|---|
| Break even | $7.94 | $184M | 6.4% |
| 12% annualized | $13.99 | $267M | 9.2% |
| 25% annualized, illustrative risk-adjusted hurdle | $24.23 | $408M | 14.1% |
| Original Base | ~$28.30 | $464M | 16.0% |
The 25% row is a sensitivity, not a universal required return. This table does not establish that the market expects 6.4% margins. It shows what the price would support under a very particular future multiple, debt and share-count assumption. If leverage stays high, or the eventual multiple is lower, substantially more operating recovery is required. A discount can be rational when permanent capital loss is a real possibility.
The nearer-term 2027 EPS bridge is revealing too: at a 12x exit P/E, the $7.94 quote requires $0.66 EPS just to break even, or ~$0.76 for a 12% annualized return through year-end 2027. The existing 2027 Base is $1.50 EPS. The potential disagreement is whether resilient Premier Protein demand can translate back into profitable cash flow despite margin damage and debt—not whether a previous $70 stock price should return.
Over the next 6–24 months, the evidence is retail consumption and share holding up without runaway promotion, input costs and gross margins stabilizing, inventory releasing cash, FY2027 guidance becoming credible, and net debt falling before large repurchases resume. A positive surprise outside the original Base would require stronger sustained margins and faster deleveraging than the modeled 16% margin / $600M debt path. If sales need heavy promotion or cash continues disappearing into working capital, the apparent gap may simply be a warning. The 2027 and 2031 target multiples already include the possibility of rerating; I don’t add a separate “market notices” gain.
Management already spent some of the optionality
The operating recovery is only half the bet. BellRing also has to allocate capital like the balance sheet matters.
Using only evidence available by September 24, BRBR lands on the leveraged-recovery / asymmetry version of the Capital Allocation Playbook:
| Asymmetry category | Score | My read on Sep. 24 |
|---|---|---|
| Thesis progress / reinvestment | 1.0 / 3 | Demand is still alive, but the actual recovery milestone — margins stabilizing and rebuilding — has not happened yet |
| Runway / financing discipline | 1.75 / 3 | Leverage is heavy, but this is not an immediate financing cliff: the revolver and senior notes run to 2030, BellRing was inside its leverage covenant, and $197.6M of revolver capacity remained at June 30 |
| Capital sequencing | 1.0 / 2 | Mixed. Repurchases shrank the denominator, but $133.1M of nine-month buybacks at $27.41/share competed with a balance sheet that now needs working-capital cleanup and deleveraging |
| Strategic focus | 1.0 / 1 | Scarce capital is still concentrated on the protein-nutrition franchise rather than a collection of unrelated side bets |
| Shareholder protection | 1.0 / 1 | This is where I should give the buybacks credit: diluted Q3 share count fell from 128.0M to 116.6M year over year, so dilution is not eating the equity story |
| Total | 5.75 / 10 | The financing runway exists. The sequencing is what I do not love. |
The repurchase result needs one giant caveat: I know the $7.94 stock price and management did not when those shares were bought. Hindsight alone does not prove the original decision was irrational.
The rerun actually made me less negative on the financing category. At June 30, BellRing’s $840M senior notes were due in March 2030, the amended revolver also ran to 2030, the company had $197.6M of available revolver capacity and it remained inside the 6.0x total-net-leverage covenant. That is real runway, even with a leveraged balance sheet. Q3 FY2026 Form 10-Q — SEC.
Where I still have a problem is sequencing. Inventory had climbed to $480.6M, nine-month operating cash flow was only $65.0M, and the company had still spent $133.1M on repurchases. Those purchases are not automatically irrational with hindsight. The forward-looking issue is simpler: operating repair and deleveraging should outrank another aggressive buyback.
The same buyback should not be punished twice. Diluted weighted-average shares fell from 128.0M in Q3 2025 to 116.6M in Q3 2026. Whatever I think of the timing, the denominator genuinely shrank. That earns the shareholder-protection point.
A 5.75/10 is not some automatic veto. It means the business has enough runway for the recovery to play out and management still has plenty of ways to make the equity outcome worse if the sequencing is bad.
The case that would actually hurt
The modeled bear case is not the worst thing I can imagine.
A nastier stress case lands around $1–$2/share using roughly:
| Stress input | Assumption |
|---|---|
| Sales | ~$2.2B |
| EBITDA margin | ~10.5% |
| Exit EV/EBITDA | 5.5x |
| Net debt | ~$1.1B |
That is what I care about for sizing. “Bear case” has a funny habit of turning into “base case but 15% lower” when nobody forces the model to get ugly.
The real permanent-loss path is weak profitability staying weak while leverage remains heavy enough that the equity never gets the recovery I am underwriting. A red quote by itself is still just a red quote. Fidelity is not doing fundamental analysis for me.
What would actually change my mind?
I care way more about these than the day-to-day stock price:
- gross margin trajectory
- input-cost inflation and freight
- promotional spending needed to defend volume/share
- inventory normalization
- Premier Protein consumption, distribution, household penetration and share
- FY2027 guidance
- debt and cash generation
- what Michael Axelrod actually does as CEO
If those improve, the better scenarios deserve more weight.
If they deteriorate, a cheaper share price by itself does not rescue the thesis.
Axelrod took over as CEO on July 29, 2026, so this is also the first stretch where his capital-allocation and operating decisions start becoming part of the evidence rather than background noise. CEO appointment — SEC.
So would I actually put money in?
At $7.94, the setup clears the hurdle for a planned ~$5K starter, not for pretending anyone knows exactly where margins land.
The business does not need to get back to peak profitability for the base case to work. It does need the current margin damage to be at least partly temporary, inventory to normalize, and leverage to stop eating so much of the equity story.
That is the bet.
And until money actually goes in, all of this is still just a model on a screen.