
CPRT: The yards, the auctions and the price I'd actually pay
A company auctioning wrecked cars doesn’t sound like the natural home for a compounding machine. Yet Copart has spent decades making the whole process hard to copy: collect the vehicle, handle the paperwork, store it, auction it to buyers across borders, and get it moving again. The website is the visible part. The yards, insurer relationships and buyer liquidity are the expensive part.
I looked at Copart because my portfolio already owns plenty of companies exposed to AI spending, directly or indirectly. I want another long-duration business whose economics come from somewhere else. Copart fits that brief much better than most of the names I screen.
The financial results made me less enthusiastic about the current entry. Copart’s revenue barely grew in fiscal 2026, operating profit fell, and it has just completed a $1.9 billion acquisition of ACV Auctions. The new business could make Copart considerably more useful to auto sellers. It also adds a loss-making marketplace and consumes cash that was previously earning interest.
At the October 19 close of $27.51, I like the standalone business more than the modeled return. My five-year Base comes out near 10.9% annualized, short of the 15% I would prefer for a new Roth IRA compounder. I would revisit around $23 if the operating thesis holds. That is a conditional valuation, not a standing buy order.
Follow a damaged car, not the stock chart
An insurer writes off a vehicle. Before anyone gets paid for its remaining value, somebody needs to collect it, process the title, document its condition, store it and put it in front of serious buyers. Copart does those jobs and charges service fees. It also buys some vehicles itself for resale, which creates different revenue and gross-margin economics. This distinction matters: not every dollar of reported vehicle sales is a marketplace fee.
Copart reports more than 250 locations across 11 countries, approximately a million members in over 185 countries and over four million vehicles sold in the most recent year. Sellers include insurers, dealers, banks, rental companies and fleets; buyers include dismantlers, rebuilders, exporters and dealers. Company operating description.
Three reinforcing advantages make it interesting.
Land and operations. Salvage facilities need correctly located, appropriately zoned sites, heavy-vehicle handling, transport and compliance workflows. A new auction website cannot create those overnight. Land is also capital intensive, so this is a real-asset moat rather than a pure asset-light software story.
Buyer liquidity. Exporters and specialist repair businesses want selection; insurers want high net recoveries and dependable turnaround. Having more of one side makes the other side more useful. It is a powerful flywheel, but insurers can and do move consignments to competitors.
Workflow and data. Title processing, vehicle inspection, transportation and seller integrations embed Copart in how a claim actually gets resolved. Those services are useful as much because they remove friction as because they add another fee.
The main competitive counterweight is IAA, owned by RB Global. Its own filings describe direct competition with Copart for insurer salvage volume. Manheim, ADESA and other auction operators become more relevant as Copart expands into clean-title and dealer wholesale vehicles. RB Global 2025 Form 10-K.
This is an industry where scale is valuable, not an industry where competitive share is guaranteed.
The financial record doesn’t currently look like a 15% grower
Copart’s July fiscal year creates an easy comparison. The numbers below are reported GAAP, not an adjusted earnings series.
| Fiscal year ended July 31 | 2024 | 2025 | 2026 |
|---|---|---|---|
| Revenue | $4.237B | $4.647B | $4.666B |
| Operating income | $1.572B | $1.697B | $1.653B |
| Operating margin | 37.1% | 36.5% | 35.4% |
| Net income attributable | $1.363B | $1.552B | $1.484B |
| Diluted GAAP EPS | $1.40 | $1.59 | $1.55 |
Source: FY2026 Form 10-K. FY2026 revenue rose 0.4% while operating income fell 2.6%. Net income fell 4.4%, cushioned somewhat on a per-share basis by repurchases.
The fourth quarter was more concerning than the annual headline. Revenue increased 2.4%, but gross profit fell 5.5%, operating profit declined 10.6% and diluted EPS fell to $0.35 from $0.41. Q4 release.
On the earnings call, management reported global units sold down 2.9% in Q4: domestic units fell 5.7%, while international volume rose 10%. Domestic insurance volume fell 7.5%. Management cited lower collision claim frequency and the loss of one large customer; it said domestic insurance assignments would have been up 2.3% without that account. That last figure is management’s counterfactual, not reported organic growth. Q4 transcript filed with the SEC.
A useful industry nuance: total-loss frequency rose to 23.3% in Q2 2026 from 22.4% a year earlier, while collision-claim frequency was falling. More accidents becoming total losses does not help Copart if there are materially fewer accidents or if a large insurer sends its vehicles elsewhere.
For now, higher revenue per vehicle and international growth are offsetting weak U.S. volume. Those are real advantages. They are not proof of a return to double-digit total earnings growth.
Good cash conversion, and now two big uses of cash
The cash statements are one of the better arguments for the quality of the underlying franchise. If I had to choose between shrinking the share count and buying another marketplace, which one actually makes each remaining share more valuable? I’m still figuring that out here. Copart’s old business gives management plenty of resources, but the ACV deal means I want to see the combined returns rather than automatically give the acquisition credit.
| Cash flow, fiscal year | FY2025 | FY2026 |
|---|---|---|
| Operating cash flow | $1.800B | $1.604B |
| Cash purchases of property and equipment | ($0.569B) | ($0.337B) |
| CFO less cash property/equipment | $1.231B | $1.267B |
| Repurchases | $0 | $1.633B |
Source: FY2026 annual cash-flow statement. FY2026 simple free cash flow improved about 3% only because capex fell faster than operating cash flow. The $1.267B is not a guarantee of repeatable owner earnings: land, vehicle-storage capacity and systems investment vary over time.
Copart spent $1.633B repurchasing roughly 43.4 million shares during FY2026 at an average $37.63. That cash outlay exceeded its simple free cash flow. The share count benefit is real; so is the opportunity cost of deploying that cash at a considerably higher price than October’s quote. FY2026 10-K.
At July 31, Copart held about $1.908B of cash and restricted cash plus $2.582B of short-term held-to-maturity investments, or $4.49B combined, against no borrowings on its revolver. September’s earnings call put total liquidity at approximately $5.7B including $1.25B of available borrowing capacity. 10-K; earnings call.
Then Copart paid $10.50 per ACV share in a transaction announced at approximately $1.9B equity value. It completed the acquisition on October 16, 2026. A rough static bridge leaves about $2.6B of Copart’s July liquid balances after the equity purchase; that is not a verified October closing cash balance or a fully adjusted acquisition enterprise-value bridge. ACV’s cash, liabilities, closing adjustments and intervening Copart cash flows still need reconciliation. Acquisition announcement; closing notice.
The acquisition and the repurchases both happened while the core business was slowing. That is where capital allocation becomes central to the investment case.
ACV could change the company. It has not yet improved the earnings.
ACV is a digital dealer-to-dealer vehicle marketplace with inspections, transport, inventory software and dealer relationships. Its model is complementary to Copart’s physical yards and international buyer demand. Copart also has more than 250 locations and management says ACV can benefit from its logistics and buyer network. Copart expects fiscal 2028 EPS accretion, with the first full year around neutral. These are management expectations, not realized synergies. Transaction terms.
ACV’s standalone FY2026 outlook as of its August Q2 report was $845M-$855M revenue and a $44M-$49M GAAP net loss, despite positive adjusted EBITDA. Its Q2 revenue was $213.9M, GAAP net loss $8.2M and adjusted EBITDA $20.8M. The adjustment includes stock-based compensation, so I would not simply add ACV’s adjusted EBITDA to Copart’s GAAP operating profit and call it synergy. ACV Q2 release.
Adding ACV’s approximate FY2026 revenue guidance midpoint to Copart’s FY2026 sales produces around $5.52B of illustrative combined annual revenue, not reported consolidated revenue. Copart closed the deal after its fiscal year, so actual consolidation starts later, and purchase accounting will matter.
The attractive path is straightforward: ACV routes more cars toward Copart buyers, Copart’s yards and transport save ACV money, and neither network has to build the other’s infrastructure from scratch.
The harder version is also plausible. ACV adds losses, different customers, more volatile dealer-wholesale demand and the prospect of goodwill or integration charges. It is also a competitive expansion into a market already served by Manheim and ADESA. A bigger addressable market only helps shareholders when returns on the $1.9B purchase exceed the capital cost.
Five years of earnings, with the acquisition accounted for
I ran the Bear / Base / Bull Playbook using $27.51, the completed October 19 close. The endpoint is October 19, 2031, five years later. Returns are share-price CAGRs excluding dividends.
I do not apply a 22x exit multiple to reported FY2026 EPS and automatically call the result Base.
The starting point for this model is $1.50 of normalized post-acquisition diluted EPS, an estimate rather than company guidance. The modeled earnings bridge predates final accounting for the conditional CEO option award described below. Here’s the bridge from Copart’s $1.55 FY2026 reported EPS:
- Reported FY2026 diluted EPS: $1.55, based on 956.9M weighted diluted shares.
- The later September 25 count was 926.3M common shares. That could lift run-rate per-share earnings by roughly $0.05 if earnings and dilution elsewhere stayed constant. It is not a final fully diluted forecast.
- Spending approximately $1.9B of cash can remove roughly $0.06 per share of after-tax interest income at a hypothetical 4% pretax yield and 23% tax rate.
- ACV losses, purchase accounting, integration expenses and eventual synergies are unsettled. I take another approximate $0.04 haircut rather than pretending its loss-making operations instantly become neutral.
That yields approximately $1.50, rounded. The last adjustment is an underwriting allowance, not an independently observed first-year P&L forecast. A different interest rate, share count or ACV margin changes this anchor. Management’s near-neutral first-full-year EPS expectation is relevant evidence, but it needs verification against actual GAAP results.
| FY2031 scenario | Bear | Base | Bull |
|---|---|---|---|
| Normalized starting EPS | $1.50 | $1.50 | $1.50 |
| EPS CAGR through 2031 | 2.5% | 9.0% | 15.0% |
| FY2031 diluted EPS | $1.70 | $2.31 | $3.02 |
| Exit P/E | 14x | 20x | 24x |
| Five-year value | $23.76 | $46.16 | $72.41 |
| CAGR from $27.51 | -2.9% | 10.9% | 21.4% |
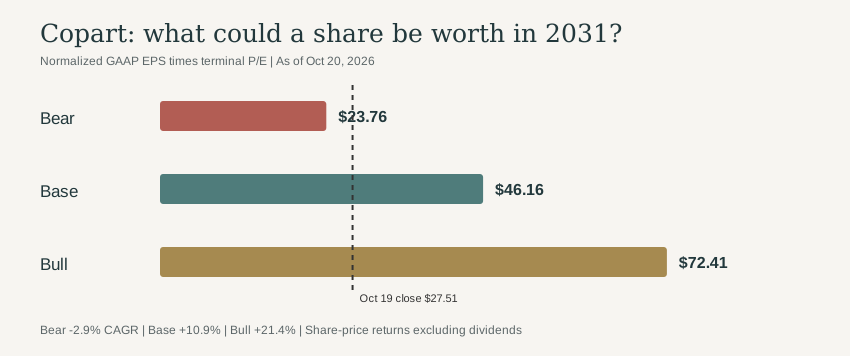
The Bear assumes the core salvage network remains profitable but U.S. insurance wins do not recover, ACV fails to earn an attractive return, and buyers stop paying a premium multiple. The Bull assumes domestic share stabilization, faster international/wholesale growth, real ACV synergies, and a market willing to pay 24x mature EPS. Neither is a promise.
The Base requires a meaningful recovery from FY2026: 9% EPS compounding, plus a still-respectable 20x terminal P/E. A reasonableness check: FY2031 revenue near $8.0B versus the illustrative $5.52B combined FY2026 run rate implies about 7.7% annual revenue growth, even with ACV added. At a 33% endpoint operating margin, operating income would be $2.64B. An eventual roughly $2.1B-$2.2B of net earnings spread across a still-lower share count gets close to my $2.31 EPS estimate. These are checkpoints, not a separate additive valuation model. The 33% group margin already assumes ACV improves considerably from its starting losses; Copart alone earned a 35.4% operating margin in FY2026.
The strongest objection to Base is that it asks for a rebound in domestic volume, attractive integration economics and a 20x endpoint multiple in combination. All are plausible; none is proven. If insurance assignments remain weak, even 9% EPS growth may be a Bull outcome.
Hold the $2.31 Base EPS fixed but cut the terminal P/E one step from 20x to 18x: value drops to $41.54, or only 8.6% annualized. Raise it to 22x and the return would be around 13.0%. Multiple choice matters, even for a quality business.
What am I actually being asked to believe at this price?
With a $1.50 normalized anchor, $27.51 is about 18.3x the estimated starting earnings. Under a 20x endpoint valuation, merely preserving the $27.51 price for five years would require roughly -1.7% annual EPS change. That is a low no-return operating hurdle, not an argument to buy.
A 15% annual share-price return at today’s price is a much harder requirement. It needs a $55.34 terminal share value. At a 20x endpoint multiple, that’s $2.77 FY2031 EPS, or approximately 13.0% EPS CAGR from the modeled $1.50 anchor. With an 18x terminal P/E it takes about 15.4% annual EPS growth; at 22x it takes about 10.9%.
That is my expectations gap, or rather the limits of it. The price does not require heroic earnings just to hold up. But my hurdle is much higher, and the reported volume/earnings trend does not yet support treating 13% post-acquisition EPS growth as the central case. No usable like-for-like combined-company FY2031 GAAP EPS consensus has been established; I will not invent one.
The positive surprises I would not count in Base today are: domestic insurer share recapture, ACV cross-selling that raises bidder liquidity and net proceeds, wholesale transportation improvements, and international expansion stronger than the current mix. Those are all real possibilities. The evidence required is insurer assignments, per-unit net revenue/cost, ACV GAAP margin, buyer activity and full-cycle incremental cash returns. Early enthusiasm from a deal announcement doesn’t create a second layer of valuation return.
Capital allocation: a good score, with a question mark beside the largest deal
I ran the Capital Allocation Playbook for a Compounder rather than defaulting to an Asymmetry score.
| Category | Score | Why |
|---|---|---|
| Reinvestment quality | 2.5 / 3 | Yards, systems and buyer reach reinforce a differentiated core business; recent per-unit cost increases remain a concern |
| Balance sheet / financing | 2.0 / 2 | Ample pre-deal liquid assets and no revolver debt at July 2026, even after allowing for a cash acquisition |
| Capital deployment | 1.25 / 2 | Repurchases and ACV make strategic sense, but $1.633B bought stock at $37.63 on average and the acquisition return is unproven |
| Strategic focus | 1.5 / 2 | Salvage, wholesale, transport and data are adjacent markets; complexity rises with ACV |
| Shareholder alignment | 0.5 / 1 | Buybacks have reduced share count, but a proposed 20M-option CEO award deserves a larger shareholder-cost discount |
| Total | 7.75 / 10 | Strong franchise, but the acquisition and CEO award both require scrutiny |
I like the willingness to buy infrastructure while other operators focus on software. The biggest open question is whether ACV improves return on invested capital or merely makes the company larger. A successful acquisition could improve Copart’s moat. It could also reduce the quality of its earnings for several years while management argues that the synergies are just around the corner.
The CEO options deserve a closer look
On October 16, Copart filed a compensation award approved by its board on October 14: CEO Jay Adair could receive options for 20 million shares outside the existing equity plan, subject to stockholder approval. The shares are divided into four five-million-share tranches with strike prices of $26.27, $35.03, $43.78 and $52.54. The options generally vest after five years and run for ten. Adair is expected to take $1 annual salary and no other substantive cash or equity compensation during that ten-year period. No options can be exercised without shareholder approval; the award is forfeited if approval fails. October 16 compensation 8-K.
There is genuine long-term alignment in making much of the potential payout dependent on a higher stock price five years out. There is also a meaningful cost to shareholders. Twenty million gross option shares equal about 2.2% of the September 25 common share count of 926.3 million. That is not an automatic 2.2% earnings dilution: share-price hurdles, exercise proceeds, vesting and any repurchases matter. GAAP stock-compensation expense, if the award is approved, also needs to be incorporated into future earnings. Our $1.50 normalized starting EPS and five-year scenario table do not yet explicitly forecast this new award.
I am keeping the published Base as an operating-case benchmark rather than guessing the accounting value of a grant that has not been approved. Before a purchase, I would rerun diluted shares, compensation expense and buy bands from the final shareholder vote and disclosures. The combination of the ACV purchase, FY2026 buybacks and this award is enough to lower shareholder alignment to 0.5/1.
How the thesis breaks
The main permanent-loss risk is not a one-month share-price drawdown. It is a deterioration of the business economics that originally justified a premium multiple:
- Insurer allocation loss. One large account already affected domestic volumes. More lost assignments would weaken yard utilization and network advantage.
- Fewer claims. Safer driving, assisted-driver systems or lower accident frequency can offset rising total-loss rates.
- Fixed-asset operating leverage in reverse. Yards, transportation and workforce cost money even when vehicle throughput falls. Q4 U.S. facility cost per unit increased materially.
- ACV overpayment/integration. Dealer-wholesale competition is different from salvage. Revenue gains, margins, working capital and purchase-accounting impacts need to be separated.
- Changing vehicle economics. Used-car residual values, insurers’ repair-versus-total decisions, EV battery economics and cross-border resale demand change recovery prices and transaction mix.
- Compensation and dilution. The conditional 20M-share CEO option award could dilute owners and create noncash compensation expense. The true cost depends on approval, vesting, exercise and accounting, not simply the headline share count.
- Valuation risk. An 18x rather than 20x exit multiple cuts the Base return by more than two annualized percentage points without changing the business outcome.
These are distinct from ordinary macro volatility. Several can happen at once.
The next six to twenty-four months
I will keep the operating checkpoints small and specific:
- November 2026 to FY2027: Do U.S. insurance assignment trends stabilize on the reported figures, and does international growth continue to outpace the domestic network? Look at global unit growth, not merely fee dollars per unit.
- First full ACV reporting cycle: Reconstruct combined revenue, GAAP operating profit, purchase accounting, cash conversion and share count. Management’s first-full-year EPS-neutral claim is a measurable checkpoint, not an assumption that removes acquisition risk.
- FY2027-FY2028: Do ACV dealer relationships and Copart’s international buyers demonstrably improve throughput and net economics? Look for margin improvement after integration costs, not only revenue synergy claims.
- Shareholder vote and subsequent reports: Confirm whether the 20M-share CEO option award is approved, how it is expensed and how many potential diluted shares enter each year’s earnings calculation.
- Across the next two years: Track capex and repurchases against actual free cash flow. Another $1B+ buyback or acquisition would need to earn a better incremental return than holding cash or investing in existing yards.
Domestic assignments repeatedly declining after adjusting for temporary weather, ACV remaining a meaningful drag with little margin progress, or operating cash conversion structurally weakening would require lowering Base. Sustained profitable wholesale integration and insurer assignment recovery could justify raising it. That is when the model changes.
Where this fits in the portfolio
Mostly Nothing already has substantial AI-linked earnings exposure in MU, SKHY, MRVL, ANET, and indirectly in MSFT, GOOG and META. Copart adds physical logistics, insurance claims and global used-vehicle remarketing. It would genuinely diversify business drivers. It would not eliminate broad equity-market risk or cyclicality.
The planned $7,500 Roth IRA contribution would be roughly 2.3% of total invested assets using the October 16 $315K portfolio snapshot. That percentage must be recalculated before a real purchase, and the account-level allocation also matters.
For an individual investor without my concentration, Copart may be an attractive franchise at today’s multiple and an approximately 11% modeled Base. For my portfolio’s 15% Base hurdle on a new long-duration Roth compounder, the price is not quite there.
Using the unchanged Base endpoint of $46.16, the implied entries are:
| Five-year annualized hurdle | Approximate entry |
|---|---|
| 12% | $26.19 |
| 15% | $22.95 |
| 18% | $20.18 |
The threshold is conditional on the current model and remaining horizon. It can move because the evidence changes, not simply because the stock gets cheaper.
Standalone view: high-quality, capital-generative company with material uncertainty around domestic volumes and a freshly acquired business. Portfolio action: no purchase, research candidate only, until 15% Base is independently supported at the then-current price. Against HCA, DECK, IBKR, a refreshed NFLX, or a broad index, the next $7,500 still has to win on expected value rather than on a story I happen to like.
Sources
- Copart FY2026 audited 10-K
- Copart FY2026 / Q4 earnings and cash-flow tables
- Copart FY2026 Q4 earnings call transcript
- Copart / ACV September merger announcement
- Copart October 16 acquisition closing
- Copart October 16 CEO option-award 8-K
- ACV Q2 2026 financial release and guidance
- RB Global 2025 10-K, including IAA competition
- October 19, 2026 CPRT historical close
Want to follow the thinking?
I write about what I'm researching, what I actually do with the portfolio, and the occasional time the evidence changes my mind. Usually about one email a week, when there's something worth sending. It's free, and I have no plans for a paid newsletter.