
ISRG — The robot is remarkable. Is the stock?
October 8, 2026 · underwriting price $415.47 (indicative screen quote; October 7 completed close $414.52)
Portfolio action: No allocation
A stock that’s nearly a third below its high, a surgical platform with a formidable installed base, and a P/E finally appearing inside a buy framework. That’s enough to make me stop scrolling.
But a 31% drawdown from $603.88 is not a valuation thesis. Intuitive’s second quarter revenue grew 19%; da Vinci procedures grew around 15%, and Ion procedures 36%. The business has kept moving. The question is what the next dollar can actually earn at $415. (Q2 results)
Thirty-one years of turning a machine into an ecosystem
Intuitive started in 1995, when surgical robotics was substantially more of an engineering problem than an established hospital purchase. Early prototypes were used in surgery during the late 1990s. The first da Vinci systems reached hospitals in 1998–1999, followed by U.S. FDA clearance for general laparoscopic surgery in 2000. Urology, including prostatectomy, became a major early adoption pathway. (Intuitive history; company historical timeline)
The 2003 acquisition of Computer Motion is an underappreciated chapter. It brought a major competitor’s assets into Intuitive and ended longstanding IP litigation. It mattered because a nascent category became less fragmented just as hospitals started treating robotic surgery as a strategic program rather than an interesting machine. (Historical SEC filing)
The hardware generations tell the other half of the story:
| Year | Development | Why it mattered |
|---|---|---|
| 1995–2000 | Founding, early da Vinci installations, FDA clearance | Turned experimental telemanipulation into commercial surgery |
| 2003 | Computer Motion acquired | Resolved an important competitive/IP conflict |
| 2006 / 2009 | da Vinci S / Si | Improved imaging, instrument capabilities and training |
| 2014 / 2017 | Xi / X | Expanded utility and added a more cost-sensitive offering |
| 2018–2019 | SP and Ion | Single-port surgery and robotic-assisted lung biopsy |
| 2024 | FDA clears da Vinci 5 | New-generation platform, force feedback and more computational capability |
| 2025–2026 | da Vinci 5 expands internationally; new indications | Makes the installed base more productive, though upgrades can distort placement comparisons |
Sources: Intuitive’s history, 2026 10-Q, da Vinci 5 clearance.
The interesting lesson from that history isn’t that Intuitive builds better robots. It’s that every generation added surgeon familiarity, instrument compatibility, service infrastructure, training and procedure volume. That creates switching friction a new entrant can’t erase with a cheaper machine.
Not an unbreakable monopoly, though. We’ll get to that.
The machine is the beginning, not the business
Intuitive sells systems, instruments/accessories and service. Hospitals can buy or lease da Vinci and Ion; procedures then create recurring instrument demand, while the installed fleet supports service revenue. In 2025 the company reported $6.019B in instruments/accessories, $2.474B in systems and $1.572B in service. Operating-lease revenue of $874M sits inside those totals, not on top. On Intuitive’s definition, $8.465B—or 84% of sales—was recurring. (2025 10-K)
That is the moat I care about. Every productive installation reinforces surgeon training, instrument orders and a hospital’s commitment to the platform. Intuitive estimates $900–$3,700 of instruments/accessories revenue per da Vinci procedure, although the range varies by procedure and is not a single blended rate. Annual system service contracts typically run $95K–$225K. (Q2 2026 10-Q)
By June 2026 the installed fleet included 11,710 da Vinci systems (+12% year over year) and 1,096 Ion systems (+21%). Utilization rose around 3% for da Vinci, which helps explain approximately 15% procedure growth: 1.12 × 1.03 − 1 is about 15.4%. Ion procedures grew another 36%. (Q2 release)
But I don’t value hardware placements at a simple sticker price. Of 468 da Vinci placements in Q2, 254 were operating leases, including 131 usage-based arrangements; upgrades and retirements also mean gross placements are not net additions. The economics depend on what hospitals do with the systems after installation.
A very good operating history, at a demanding price
The company grew revenue 18.9% annualized from 2023 to 2025 while expanding GAAP operating margin. These aren’t adjusted figures designed to make a good business look even better:
| Reported, US$ billions except EPS | 2023 | 2024 | 2025 |
|---|---|---|---|
| Revenue | $7.124 | $8.352 | $10.065 |
| Gross margin | 66.4% | 67.4% | 66.0% |
| Operating income | $1.767 | $2.349 | $2.946 |
| Operating margin | 24.8% | 28.1% | 29.3% |
| Net income attributable | $1.798 | $2.323 | $2.856 |
| GAAP diluted EPS | $5.03 | $6.42 | $7.87 |
Source: Intuitive 2025 Form 10-K. This performance didn’t require gutting research: R&D was $1.312B, around 13% of 2025 revenue. That ongoing expense matters because tomorrow’s surgery platform won’t remain competitive merely because yesterday’s was dominant.
For a fair trailing comparison, I use FY2025 + H1 2026 − H1 2025, not Q2 multiplied by four. That gives $11.034B in revenue, $3.451B in operating income and $3.139B in net income attributable. The corresponding GAAP EPS bridge is $7.87 + $4.57 − $3.72 ≈ $8.72. It’s approximate because the periods have different weighted diluted share counts; net income is the cleaner numerator. At $415.47 the share price is 47.6x trailing earnings, not the 41.5x implied by an older, unproven $10 normalized EPS proxy. (2025 10-K; Q2 2026 10-Q)
My FY2026 forecast uses $11.65B revenue × 28.5% attributable net margin / 358M diluted shares ≈ $9.27 EPS. That’s 44.8x even the forward estimate. The $11.65B revenue forecast requires $5.987B in H2 2026 sales versus $5.371B in H2 2025, about 11.5% growth—below the reported H1 pace. This is my estimate, not Intuitive guidance.
It’s also why I don’t simply carry forward the old P/E buy bands. A 42x multiple on a hypothetical $10 EPS gives $420; on the actual $9.27 forecast it gives about $389. Neither shortcut tells me whether buying at that price can earn an attractive return.
Cash generation is substantial, though not as simple as it looks. Here’s the trailing bridge, using reported FY2025, H1 2026 and H1 2025 in that order:
| Cash-flow bridge, US$ billions | FY2025 | + H1 2026 | − H1 2025 | Trailing |
|---|---|---|---|---|
| Operating cash flow | 3.0305 | 1.9729 | (1.2970) | 3.7064 |
| Cash PPE purchases | (0.5398) | (0.2159) | +0.2719 | (0.4838) |
| Simple free cash flow | 3.2226 |
Using 353.9M June 30 common shares, $415.47 × 353.9M ≈ $147.03B equity value, so simple FCF yield is $3.2226B / $147.03B = 2.19%. I wouldn’t call that owner earnings: $419M of H1 2026 equipment transfers from inventory into leased fixed assets were noncash, while H1 stock compensation added back to operating cash flow was also $419M ($788M in full-year 2025). An investment thesis based only on a headline FCF figure would miss those economic costs. June 30 cash and investments totaled about $8.626B, leaving plenty of flexibility. (2025 10-K; 2026 10-Q)
Competition is no longer theoretical
The moat is real, but the competitor slide from 2019 is not the right competitor slide for 2026.
Medtronic’s Hugo received U.S. FDA clearance in December 2025 for specified urologic surgeries, including prostatectomy, nephrectomy and cystectomy. Johnson & Johnson’s OTTAVA received U.S. De Novo authorization in July 2026 for multiple upper-abdominal general surgery procedures. Both are serious industry participants; neither has magically replicated Intuitive’s installed base or surgeon workflow. (Medtronic announcement; J&J authorization)
There are also local competitors, especially in China. Intuitive itself says Chinese tenders have faced delayed procurement and intensified local competition. I don’t need robotic surgery to fail for the economics to disappoint; I’d only need a meaningful part of incremental new procedure growth to become less profitable.
And I don’t take “robot-assisted” as automatic proof of a superior clinical outcome in every procedure. An academic systematic review of randomized abdominal and pelvic surgical trials found no significant mortality differences and no statistically significant overall complication advantage in most included trials. Clinical advantages can depend heavily on procedure, surgeon expertise and the alternative technique. That matters for future reimbursement and hospitals’ willingness to pay. (Systematic review)
What five more years of growth actually buys
The FY2031 Base isn’t weak. It assumes 14% revenue growth from my $11.65B FY2026 estimate and steady improvement in operating profitability. Below are the actual inputs and the resulting earnings—not just three price targets.
| FY2031 assumptions and outcomes | Bear | Base | Bull |
|---|---|---|---|
| Revenue CAGR, FY2026–2031 | 8% | 14% | 18% |
| Gross margin | 66.5% | 69.0% | 71.0% |
| SG&A / revenue | 24.0% | 23.0% | 22.5% |
| R&D / revenue | 13.5% | 12.5% | 12.5% |
| Operating margin | 29.0% | 33.5% | 36.0% |
| Annual diluted-share change | +0.5% | −0.5% | −1.0% |
| FY2031 revenue, billions | $17.118 | $22.431 | $26.652 |
| FY2031 net income attributable, billions | $4.185 | $6.312 | $8.046 |
| FY2031 diluted shares, millions | 367.04 | 349.14 | 340.45 |
| FY2031 diluted EPS | $11.40 | $18.08 | $23.63 |
| Terminal P/E | 26x | 36x | 42x |
| Per-share value | $296 | $651 | $993 |
| Annualized return from $415.47 | −6.2% | +9.0% | +18.1% |
The calculation is reproducible without a ten-step walkthrough. For each case: revenue is $11.65B × (1 + growth rate)^5; subtract SG&A and R&D from gross profit, add 1% of revenue in other income, apply an 18% tax rate and deduct 0.15% of revenue for noncontrolling interests. Diluted shares start at 358M and change at the rate shown for five years. For Base, this produces about $6.312B attributable income / 349.14M shares ≈ $18.08 EPS. Multiply by 36x to get $651.
These are my GAAP-style operating assumptions, not company guidance. I don’t add back stock compensation to make earnings look bigger.
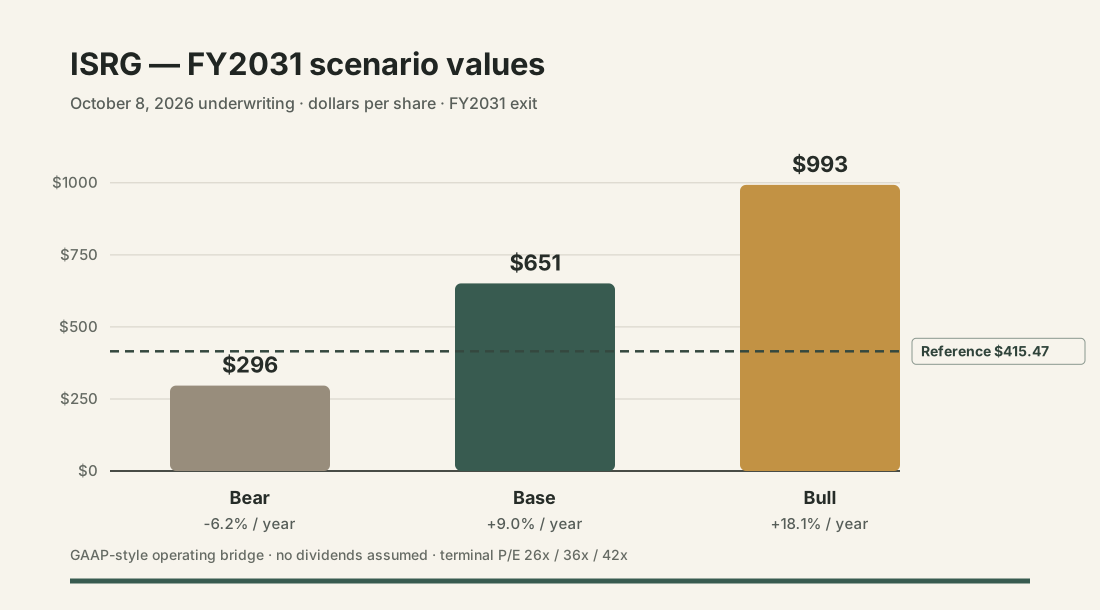
The operating forecast runs five fiscal years, from estimated FY2026 through FY2031. The investor’s clock runs from October 7, 2026 through December 31, 2031—about 5.232 years. That’s why my Base return is ($651 / $415.47)^(1 / 5.232) − 1 ≈ 9.0% annually, rather than treating five fiscal periods as exactly five years of ownership.
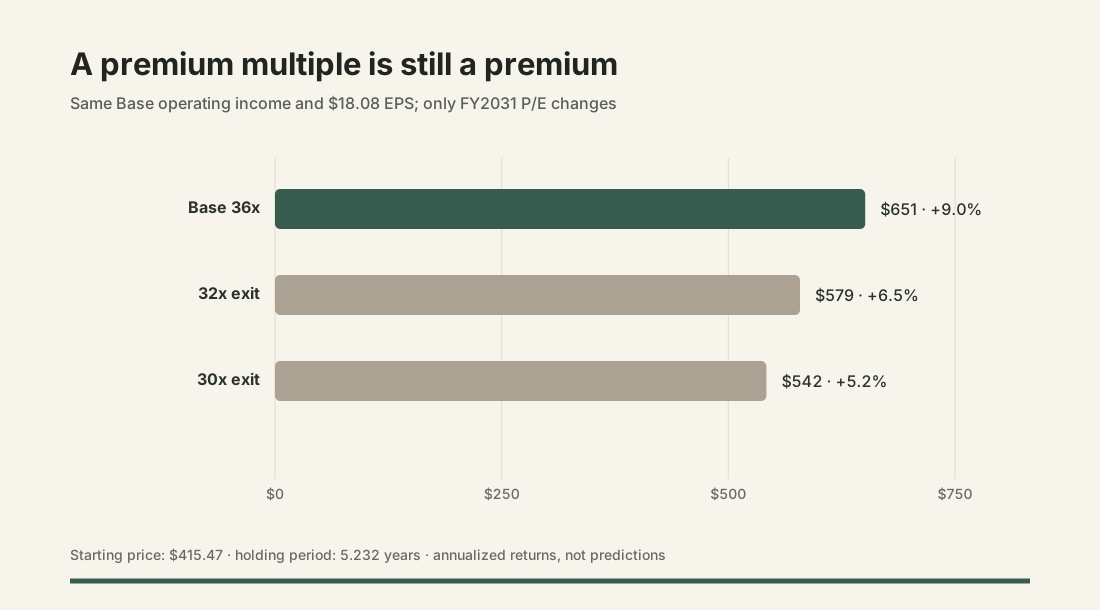
What bothers me isn’t the possibility of 14% growth. It’s asking a much larger, more mature Intuitive to command 36x earnings in 2031. Keep $18.08 Base EPS unchanged and a 32x multiple yields about $579, or 6.5% annualized. At 30x it’s $542, or 5.2%. Drop revenue CAGR to 12% with the other Base inputs intact and the model yields roughly $596, or 7.1%. A strong business result can still produce a disappointing stock result.
What would make $415 worth paying?
Reverse the math. To earn my 12% starter hurdle at a 36x FY2031 exit, Intuitive would need about $20.88 in EPS. Under the same Base margins and share count, that’s $25.91B in revenue, requiring 17.3% annual growth from the FY2026 estimate. The hurdle starts resembling Bull rather than Base.
| Requirement for 12% annualized | 36x FY2031 exit | 32x FY2031 exit |
|---|---|---|
| Required FY2031 EPS | $20.88 | $23.49 |
| Revenue needed at Base margins | $25.91B | $29.15B |
| Revenue CAGR, FY2026–2031 | 17.3% | 20.1% |
These are conditional requirements under my valuation model, not documented analyst consensus. The market is already paying a large premium for robotic-surgery growth, so I do not see a demonstrated expectations gap at this price.
There is a credible positive surprise: da Vinci 5 could push utilization higher for years, while Ion becomes a much larger and more profitable recurring-revenue business. To put that into Base I’d want to see sustained procedure growth per productive system, strong instruments revenue per case, healthy system-lease cash conversion, and retention as Hugo and OTTAVA become more widely available. Bull already assumes a faster ramp and a 42x exit; I won’t count that upside a second time just by calling it a catalyst.
Management’s money versus my money
I score Intuitive 9.0/10 under the Compounder capital-allocation rubric: 3.0/3 for reinvestment quality, 2.0/2 for financial strength, 1.5/2 for capital deployment, 1.75/2 for strategic focus and 0.75/1 for shareholder alignment.
That is a high score, not a blank cheque. Stock compensation was $788M in 2025, and H1 2026 repurchases of $1.44B still have to prove they offset dilution at sensible prices. Leasing, new platforms and manufacturing capacity need cash too. (2025 10-K; Q2 2026 10-Q)
A $651 Base endpoint implies entry prices of roughly $360 for 12%, $313 for 15% and $274 for 18% annualized over the same holding period. Each follows the same formula: entry price = $650.85 / (1 + required return)^5.232. Those are return-based thresholds, not forecasts of where the stock trades next.
Where I land
I would happily own Intuitive for a long time. The recurring economics, training network and installed base deserve a premium. But Medtronic and J&J now have genuine authorized alternatives, and a 36x endpoint leaves little room for earnings or valuation disappointment.
At $415, even a strong Base delivers roughly 9% annualized—below the return I want for adding an individual stock. I am not allocating capital today. Around $360, with the operating thesis intact, the first small position becomes a much better question.
The next check is the October 20 earnings report. What matters isn’t whether the stock bounces; it’s whether procedure utilization, recurring revenue per case, margins and cash conversion suggest an earnings path better than the one I’m underwriting. (Investor Relations)
The reported financials, reconstruction math, scenario drivers, terminal sensitivities and required-return entry prices are all on this page so the case can be judged here. Source documents are linked at the point of each claim. The Bear / Base / Bull and Capital Allocation Playbooks explain the reusable frameworks.