
MCO — A different engine, not a different set of rules
October 11, 2026 · reference: $464.23 (October 9 closing price)
Portfolio action: No allocation. Watching for a better expected return.
I started looking harder at Moody’s for a reason that has more to do with what I already own than with what Moody’s has done wrong.
A substantial part of my portfolio is connected to AI infrastructure and the businesses building or monetizing it. I’m still bullish on that thesis. The Risk Map simply made the overlap harder to ignore: multiple positions can be excellent independently and still depend on the same spending cycle. MU and SK hynix, for example, have recently moved together to a degree that holding both ticker symbols does not magically erase.
So I want another long-duration compounder whose earnings are driven by something different. Not a defensive trade, not a declaration that the AI thesis is over, and definitely not a reason to buy an expensive stock just to tick the Financials box.
Moody’s fits the business brief: credit ratings, risk data, analytics and deep institutional workflows. The question is whether it also fits the return brief.
At Friday’s $464.23 close, it trades at roughly 27.7x the midpoint of 2026 adjusted EPS guidance. The business quality deserves a premium. Whether I get paid enough to own that premium for five years is another matter. (October 9 closing price; Q2 2026 results)
Two businesses, and why they belong together
Moody’s Investors Service (MIS), the ratings arm, is the more unusual franchise. Companies, financial institutions, governments and structured-finance issuers need investors to assess credit risk. A credible rating is embedded in issuance documents, mandates, institutional processes and regulatory reporting. Moody’s charges for new ratings and ongoing surveillance. When debt issuance picks up, transaction fees can rise quickly without expenses moving in lockstep.
Moody’s Analytics (MA) sells the surrounding decision infrastructure: credit research, company and financial data, know-your-customer tools, insurance and banking risk products, and applications that sit inside institutional workflows. It is more recurring, although less spectacularly profitable than ratings.
In 2025, MIS generated $4.119B of external revenue and MA $3.599B, for $7.718B combined. The mix matters: this is not a pure software subscription stock, and it isn’t a pure issuance bet. (2025 annual report)
That combination is attractive. MIS can earn extraordinary incremental margins in strong funding markets; MA generates steadier customer relationships and recurring revenue. MIS ratings and research also help support MA’s differentiated data proposition. The more data and decisions a financial institution builds around these systems, the more painful an apparently cheaper substitute can become.
The counterargument is that Moody’s still depends on institutions paying for information and assessments they could increasingly try to reproduce with cheaper tools. The products are complementary, but they’re not interchangeable insurance policies against one another failing.
The regulatory moat is real. So is the competition.
As of December 2025, the SEC counted 10 registered NRSROs. Moody’s had roughly 684,000 outstanding ratings, S&P Global roughly 1.078 million, and Fitch about 274,000. Moody’s and S&P together accounted for roughly 80% of the reported outstanding rating count among those agencies. That’s evidence of scale and embeddedness—not a claim of 80% of current fee revenue or new issuance, which those counts do not measure. (SEC NRSRO statistics)
The advantage is a combination of brand, investor acceptance, regulatory recognition, analytical history, and the practical cost of changing established debt-market workflows. Rating an issuer isn’t like swapping a cloud vendor after a free trial.
Still, the industry isn’t frozen in amber. Fitch competes across major markets. KBRA and DBRS have real share in structured finance; their presence matters precisely where a casual ‘ratings oligopoly’ story can become complacent. Issuer-pays economics also create perennial independence and reputational risks. Ratings mistakes, litigation or a change in regulation can alter the value of the franchise more seriously than an ordinary bad quarter.
My working judgment: the moat should be hard to displace. That is a high-quality starting point, not a license to forecast double-digit growth in the ratings business forever.
What the latest reported quarter actually says
The most recent reported results available as I write are for Q2 2026. Q3 results are scheduled for October 21, so none of the numbers below imply I have seen them. (Q3 earnings date)
| Reported metric | Q2 2026 | What I take from it |
|---|---|---|
| Total revenue | $2.185B, +15% y/y | Strong, but MIS drove most of the acceleration |
| MIS revenue | $1.260B, +25% y/y | Debt issuance is a powerful profit lever |
| MIS transaction revenue | $891M, +34% y/y | Around 71% of MIS’s quarter depended on transactions |
| MA revenue | $925M, +4% y/y | Headline growth diluted by divestitures |
| MA organic constant-currency growth | +8% | Better read on retained products |
| MA ARR | $3.661B, +9% y/y | Underlying recurring engine remains healthy |
| MA recurring share of quarterly revenue | 99% | Very different economics from new ratings issuance |
| GAAP operating margin | 47.9% | Substantial reported profitability |
| Adjusted operating margin | 55.3% | Strong leverage, but a non-GAAP measure |
| First-half free cash flow | $1.532B, +34% | Cash engine is working |
Source: Moody’s July 22 earnings release.
There’s one tension I don’t want to hide in that table. Moody’s Analytics reported only 4% growth, but its organic constant-currency revenue was up 8% because divestitures distorted the year-on-year comparison. Conversely, MIS was up a spectacular 25% partly because rated issuance volumes were up 33%. Extrapolating that quarter at 25% growth for five years would be a very convenient way to arrive at a silly valuation.
Two other details matter. MIS transaction revenue accounted for $891M of $1.260B, so a ratings recession can hit profits fast. And Moody’s specifically linked some strong public/project/infrastructure finance activity to data centers and the broader technology infrastructure buildout. Even my ‘different engine’ has some exposure to the AI cycle. (Q2 release, MIS commentary)
What five years of reported performance look like
The 2025 annual report gives a useful baseline for how much of this business has already improved:
| Reported annual figures | 2024 | 2025 |
|---|---|---|
| Revenue | $7.088B | $7.718B |
| Operating income (GAAP) | $2.875B | $3.351B |
| GAAP operating margin | 40.6% | 43.4% |
| GAAP diluted EPS | $11.26 | $13.67 |
| Adjusted diluted EPS | $12.47 | $14.94 |
| Free cash flow (company definition) | $2.521B | $2.575B |
The improvement was real. Revenue grew 9% while operating earnings grew 17%. But $2.575B of 2025 free cash flow against $3.351B GAAP operating income also reminds me that ‘capital light’ doesn’t mean every dollar of accounting profit becomes cash immediately. Working capital, taxes, compensation and investment still matter. (2025 annual report)
AI diversification, with the caveat everyone should read
I do not want to sell a technology stock to buy Moody’s because I’ve suddenly decided AI is a bad investment. I want to avoid confusing multiple good AI businesses with multiple independent sources of future returns.
The Risk Map’s October 11 historical-return check makes this concrete:
| Pair | One-year daily-return correlation | Matched days |
|---|---|---|
| MU / SKHY | +0.81 | 64 |
| MCO / MU | −0.13 | 250 |
| MCO / MRVL | −0.15 | 250 |
| MCO / FXAIX | +0.25 | 250 |
| MCO / MSFT | +0.28 | 250 |
These are Pearson correlations of overlapping daily returns from public price histories, calculated by the Risk Map. The SKHY sample is especially short, correlations move, and a low historical coefficient does not prove protection in a recession or market-wide liquidity shock.
What I’m actually buying if I buy is the ability to earn money from debt ratings, risk information and institutional decisions rather than depending chiefly on HBM prices, accelerator networking or hyperscaler capital expenditure. That is economic diversification, not a hedge with a promised negative beta.
There is even a slight irony here: Moody’s is developing its own generative AI products, including Research Assistant and integrations that deliver its data and analytical frameworks through AI platforms. Those can improve distribution, but they also expose some analytics products to automation and pricing competition. Meanwhile, infrastructure financing helps MIS issuance volumes. Less AI-dependent is not AI-proof. (Moody’s AI solutions; AI skills announcement)
That’s still an improvement for my portfolio. I just refuse to overstate it.
Cash generation and what management does with it
On June 30, 2026, Moody’s reported $1.467B cash, $29M short-term investments, $571M current debt, and $6.375B long-term debt. That works out to approximately $5.45B net debt, before treating leases or other obligations as debt. Good cash generation makes it manageable, but Moody’s does carry meaningful leverage. (Q2 consolidated balance sheet)
Management guided FY2026 operating cash flow to $3.15B–$3.35B and free cash flow to $2.7B–$2.9B, reflecting approximately $450M in capital additions, including unusual office-relocation spending. At the $464.23 reference price and 174.5M Q2 diluted shares, illustrative equity value is roughly $81.0B. The $2.8B FCF midpoint therefore implies a 3.5% forward FCF yield. Not cheap, but materially different from a business where near-term owner cash flow barely exists. (Q2 earnings guidance and share count)
The capital allocation deserves both credit and scrutiny. Moody’s repurchased about $2.165B of stock and paid $365M in dividends in the first half, versus $1.532B in FCF. It distributed more cash than it generated over those six months, drawing down the cash balance. That isn’t automatically reckless with this balance sheet, but a buyback isn’t a free per-share return if management keeps paying a demanding multiple or needs debt to fund it.
Also, Moody’s adjusted EPS excludes acquired-intangible amortization and other costs. Some adjustments are genuinely unusual; acquisition amortization reflects capital previously spent on assets that do contribute to revenue. I use adjusted EPS transparently as the model anchor, then check it against GAAP earnings and actual cash generation. I don’t pretend the adjustments make economics disappear.
What I can underwrite without assuming an endless ratings boom
Management’s July guidance was for high-single-digit 2026 consolidated revenue growth and $16.50–$17.00 adjusted diluted EPS. The midpoint is $16.75. GAAP diluted EPS guidance is $16.00–$16.50, so the same price is about 27.7x adjusted or 28.6x GAAP guidance midpoint. Neither is a distressed multiple. (Q2 guidance and reconciliation)
I built the forward model from the two businesses, not from an old share-price high or an attractive round-number P/E.
First I use the $7.718B FY2025 revenue base and management’s 2026 consolidated growth outlook to estimate about $8.34B FY2026 revenue. I split that into $3.89B MA and $4.45B MIS for modeling purposes; those are my estimates, not separate company guidance.
Then, for each FY2031 scenario:
- Grow MA and MIS revenue separately for five fiscal years.
- Apply a consolidated adjusted operating margin.
- Convert adjusted operating profit into attributable adjusted net income after modeled interest, tax and other below-the-line effects.
- Divide by a diluted share count that explicitly accounts for repurchases.
- Apply a terminal adjusted P/E. None of the target prices includes dividends.
The conversion factor is important. At a modeled 52.5% adjusted 2026 operating margin, $8.34B of revenue implies ~$4.38B adjusted operating earnings. About $2.92B of adjusted net income ($16.75 × 174.5M diluted shares) means roughly 66.7% of that operating profit reaches adjusted shareholders’ earnings. I use that as a starting reality check, not the fantasy that 100% of operating earnings can be capitalized.
FY2031 operating scenarios
| Model input / result | Bear | Base | Bull |
|---|---|---|---|
| MA revenue CAGR, 2026–31 | 5% | 9% | 12% |
| MIS revenue CAGR, 2026–31 | 1% | 6% | 10% |
| FY2031 MA revenue | $4.97B | $5.99B | $6.86B |
| FY2031 MIS revenue | $4.68B | $5.96B | $7.17B |
| FY2031 total revenue | $9.64B | $11.94B | $14.02B |
| Adjusted operating margin | 50.0% | 55.0% | 56.0% |
| Adjusted operating-profit-to-net-income conversion | 66.0% | 68.5% | 71.0% |
| Annual change in diluted shares | 0% | −1.0% | −1.25% |
| FY2031 diluted shares | 174.5M | 166.0M | 163.9M |
| FY2031 adjusted EPS | $18.23 | $27.11 | $34.02 |
| FY2031 terminal adjusted P/E | 21x | 27x | 32x |
| Terminal value per share | $383 | $732 | $1,089 |
| Annualized price return from $464.23 | −3.6% | +9.1% | +17.7% |
Numbers rounded for readability. The actual calculations use unrounded segment growth, margins and diluted-share math. Returns run from the October 9, 2026 reference close through December 31, 2031—approximately 5.23 calendar years, not exactly five. The business forecast uses five 2026–31 fiscal growth periods. Dividends are excluded.
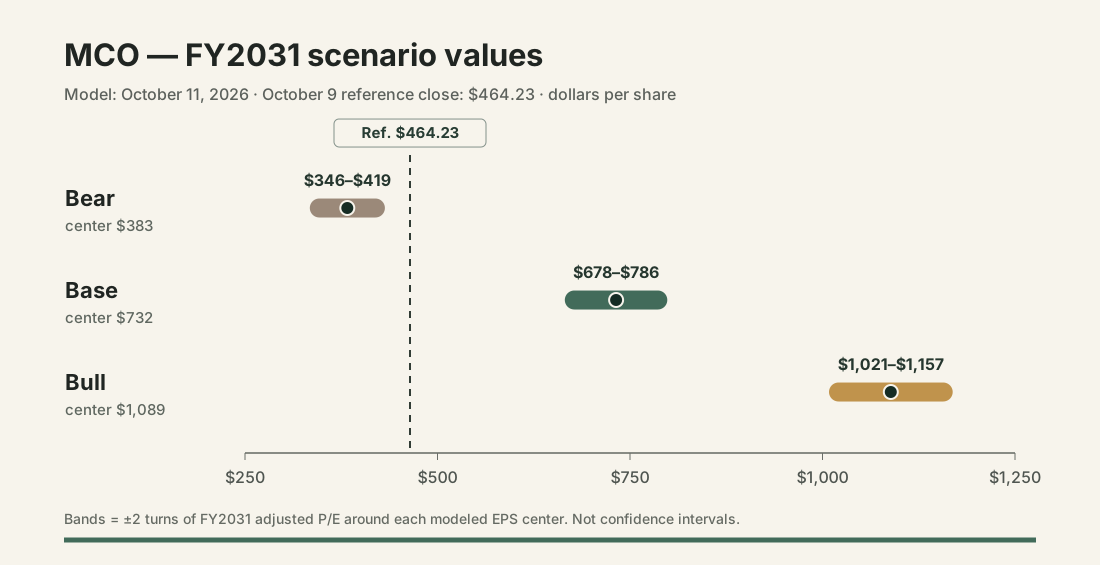
The bands show a ±2x terminal P/E sensitivity around each scenario’s modeled EPS, not statistical confidence intervals. Those are plausible valuation variations within a scenario, not additional probabilities or a replacement for the Bear/Base/Bull operating assumptions.
For Base, the arithmetic is: $3.89B × 1.09^5 of Analytics revenue plus $4.45B × 1.06^5 of ratings revenue ≈ $11.94B. At 55% adjusted operating margin and 68.5% conversion, that’s approximately $4.50B adjusted net income. Reducing 174.5M diluted shares by 1% each year produces about 166.0M shares, or $27.11 adjusted EPS. At 27x, I get about $732 per share. From $464.23, that’s roughly 9.1% annualized before dividends.
That isn’t a weak company outcome. It assumes healthy Analytics growth, ratings continuing to grow through multiple issuance environments, modest margin expansion and sustained net share reduction. The problem is simply that a lot of this is already in the $464 price.
I am especially careful with the 6% MIS growth assumption because the model starts after an unusually strong issuance period. Cut just MIS to 3% annual revenue growth, leaving Base Analytics, margin, conversion, shares and multiple unchanged, and FY2031 adjusted EPS falls to about $25.30, the target to $683, and annualized price return to roughly 7.7%. No catastrophic regulatory change required. Ratings merely needs a less generous full cycle than I assumed.
The Bear doesn’t need ratings to become irrelevant: 1% MIS revenue growth, 5% MA growth, a 50% margin and 21x earnings can deliver a negative share-price CAGR despite the business remaining profitable. The Bull needs MA to accelerate to 12%, MIS to compound 10% through a whole cycle, margin to improve and 32x earnings still to be available in 2031. Possible? Yes. The outcome I should underwrite as normal? No.
Reverse the price instead of celebrating the moat
If Base ends at roughly $732, what price today clears my return hurdles?
| Required annualized price return | Maximum modeled entry price |
|---|---|
| Starter: 12% | ~$405 |
| Normal: 15% | ~$353 |
| Aggressive: 18% | ~$308 |
These levels follow the FY2031 Base, the October 9-to-December 31 investment horizon and the specified return hurdle. They will move when evidence changes the Base assumptions. They are not automatic order prices.
At $464, a 12% price CAGR would require roughly $31.09 of FY2031 adjusted EPS at a 27x exit, versus my modeled $27.11. That’s an implied ~13.2% annual EPS growth rate from the $16.75 anchor, compared with the roughly 10.1% embedded in Base. Alternatively, holding the Base EPS constant would require a terminal multiple above 31x.
I don’t think either is impossible. I also don’t think the market is obviously ignoring them.
A good business, a less forgiving multiple
| Same Base operating result ($27.11 EPS) | FY2031 price | Annualized price return |
|---|---|---|
| 24x adjusted P/E | ~$651 | ~6.7% |
| 27x adjusted P/E | ~$732 | ~9.1% |
| 30x adjusted P/E | ~$813 | ~11.3% |
That is the cost of paying a premium for widely recognized quality. Business execution can be fine while valuation compression quietly eats several years of returns.
For a harder stress test, take only ~1% annual adjusted EPS growth from the FY2026 anchor and an 18x exit. You get about $317 in terminal value, approximately −7.1% annualized before dividends. Not a prediction, and certainly not the most likely outcome. It’s a reminder that a wonderful rating agency can lose substantial shareholder value without anything close to bankruptcy.
The expectation gap, if there is one
I see two ways my Base could be too conservative.
First, ratings could have a bigger structural tailwind than a normal refinancing cycle. Private credit, infrastructure debt, securitization and continuing global funding needs can expand the addressable rating and surveillance universe. But I want evidence of durable fee growth outside unusually heavy issuance quarters, not one quarter of accelerated volume.
Second, Analytics may be able to sell substantially more products into the same clients. The combination of proprietary data and genuinely useful AI-enabled workflows could increase customer value and retention while reducing delivery costs. Nine-percent ARR growth could become sustainably faster. But MA’s headline Q2 growth was 4%, not 14%, and AI could also make portions of research and interface distribution easier for rivals to replicate. I’d want to see higher organic ARR, strong net retention or additional workflow penetration and improving margins before putting that surprise into Base.
The critical distinction: faster recognition of a higher earnings trajectory in the market price is not a second source of terminal return on top of the EPS × P/E model. Nor does putting ‘AI’ in an analytics product justify software-company terminal multiples automatically.
What can break the thesis?
There are four risks I’d monitor more closely than daily share-price changes.
Issuance normalization. MIS has exceptional operating leverage in both directions. If funding markets seize up or Q2 volumes were pulled forward, ratings revenue and margins may fall considerably more than the broad economy. Q3 on October 21 is an immediate test.
Ratings competition and trust. S&P, Fitch, KBRA, DBRS and others compete on coverage, price and speed. An independence scandal, poor ratings through a major default cycle, or a regulatory shift can erode the reputation the moat depends on. Structural share loss matters more than one bad issuance quarter.
Analytics commoditization. Moody’s proprietary datasets, models and embedded integrations are valuable. But clients can increasingly access general-purpose AI analysis cheaply. The real defense must be superior underlying data, governance, distribution rights and reproducible decision workflows—not a chat interface.
Capital allocation. Net debt is about $5.45B, adjusted EPS differs from GAAP, and first-half 2026 buybacks plus dividends exceeded first-half free cash flow. That combination is fine only if cash remains strong and management doesn’t overpay for growth or its own shares.
I would also watch stock-based compensation and the diluted share count rather than assuming an authorized repurchase mechanically reduces share count by the headline dollar amount.
Portfolio fit and what gets my next dollar
Here is why Moody’s is appealing specifically for me:
- It adds a different core earnings driver than MU, SKHY, MRVL and the hyperscaler spending cycle.
- The franchise is profitable, cash-generative and entrenched enough to plausibly compound through decades of ordinary technological change.
- The Risk Map suggests its recent market behavior has been less aligned with my memory positions, although that is historical co-movement, not forward protection.
- Financials remains an area where my portfolio has less exposure than an S&P 500 reference, even after index-fund look-through.
But I already get Financials exposure through index funds, and the portfolio doesn’t need a new ticker for appearance’s sake. A 2%–4% eventual core position might make sense when the expected return earns it; a starter should be smaller and should compete against adding to the other holdings or FSMAX/FXAIX.
At this reference price, 9.1% modeled Base price CAGR plus a modest dividend is not such an extraordinary opportunity that I should override a 12%+ individual-stock hurdle. Index funds offer broader diversification without requiring one company-specific judgment. Other candidates, including ISRG, deserve the same valuation discipline.
I’ll revisit the model after October 21 earnings, paying particular attention to MIS transaction volume and margins, MA organic/ARR growth, free-cash-flow conversion, and buyback impact on actual shares. A strong result would need to raise independently underwritten 2031 earnings power, not merely confirm that Moody’s remains a very good company.
The portfolio reason got this business onto my desk. The return on the next dollar decides whether it gets into my account.
Sources and model notes
- Moody’s Q2 2026 earnings release and FY2026 guidance (July 22) — segments, ARR, margins, cash flow, buybacks and GAAP/adjusted reconciliation.
- Moody’s Q2 2026 Form 10-Q (filed July 23) — financial statement and risk-factor cross-check.
- Moody’s 2025 annual report / 10-K — operating history, revenue mix, cash flow and risks.
- SEC NRSRO statistics, 2025 reporting year — registered agencies and ratings counts; not a proxy for fee share.
- Moody’s AI strategy and research products and 2026 AI skills launch.
- Moody’s Q3 2026 earnings schedule (October 21).
- MCO October 9 closing price and Risk Map methodology.
Model basis: all share prices and implied annualized returns use the October 9, 2026 $464.23 close. 2026 guidance is the latest publicly reported FY outlook as of this note. FY2026 MA $3.89B/MIS $4.45B revenue, FY2031 segment growth, adjusted margin, conversion, share-count path and terminal P/E are my modeled estimates, not Moody’s guidance, a consensus forecast or a guaranteed range. Dividends are excluded from scenario CAGRs; the approximate current dividend yield is additional only if sustained, with reinvestment and price path uncertain.
The reusable analytical framework is Bear / Base / Bull and the investment’s capital-use discipline is Capital Allocation.